Welcome to the world of statistics, where numbers tell a story and standard deviation plays a crucial role in unraveling that narrative. How to calculate standard. Have you ever wondered how data spreads out around the mean? Well, that’s where standard deviation steps in! In this blog post, we will dive into the depths of calculating standard deviation, demystifying this statistical concept along the way. So buckle up and get ready to sharpen your math skills as we explore the ins and outs of standard deviation together! Also, Click
Understanding Standard Deviation
Standard deviation is like a compass guiding us through the vast sea of data, helping us navigate and make sense of the numbers before us. It measures how spread out our data points are from the average, giving us insights into the variability within a dataset. Think of it as a measure of uncertainty or dispersion – the larger the standard deviation; the more scattered our data points; conversely, a smaller standard deviation indicates that our data is clustered closely around the mean.
Understanding standard deviation empowers us to grasp the distribution characteristics of our data set better. It allows us to quantify and visualize variation, making comparisons and drawing conclusions with more confidence. By grasping this fundamental statistical concept, we gain a deeper appreciation of how individual values relate to the overall dataset’s central tendency.
The Importance of Standard Deviation in Statistics
When it comes to statistics, standard deviation plays a crucial role in understanding the variability within a data set. It provides valuable insights into the spread of data points around the mean, helping researchers and analysts make informed decisions based on the level of dispersion present.
By calculating standard deviation, statisticians can determine how closely individual data points cluster around the average, giving them a clearer picture of the consistency or volatility within their dataset. This measure is particularly useful in fields like finance, quality control, and social sciences, where precision and accuracy are paramount.
In essence, standard deviation helps us grasp not just what our data says at face value but also how much confidence we can have in those numbers. It allows us to quantify uncertainty and assess risk more effectively by painting a more comprehensive picture of our dataset’s distribution pattern.
Steps to Calculate Standard Deviation
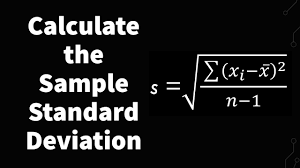
Calculating standard deviation may sound daunting at first, but breaking it down into simple steps can make the process much more manageable. The first step is to find the mean of the data set by adding up all the values and dividing by the total number of data points. Next, subtract the mean from each value to get the deviations. Then square each deviation to eliminate negative values. After that, add up all the squared deviations and divide by one less than the total number of data points for variance.
To finally get the standard deviation, take the square root of this variance. This final step gives you a measure of how spread out your data is from its average value. While it may involve a few calculations, understanding these steps can help you gain valuable insights from your dataset with confidence.
Example Calculation
Let’s dive into an example calculation to understand better how to calculate the standard deviation.
Imagine you have a set of numbers: 5, 8, 10, 12, and 15. First, find the mean by adding all the numbers and dividing by the total count – in this case, it would be (5+8+10+12+15)/5 = 50/5 = 10.
The next step is to find the variance for each number – subtract the mean from each number and square the result: (5-10)^2 = 25; (8-10)^2 =4; (10-10)^2=0; (12-10)^2=4; (15-10)^2=25.
Add up these squared differences: 25 + 4 +0 +4 +25 =58. Then divide this sum by one less than the total count of numbers – here, it would be divided by four since there are five numbers.
Completing this calculation gives us a variance of approximately equal to 14.50 before finding its square root which equals about 3.80 as our standard deviation for this dataset!
Interpreting the Results
Once you have calculated the standard deviation, it’s time to interpret the results. The standard deviation provides a measure of how spread out the data points are from the mean. A lower standard deviation indicates that the data points are closer to the mean, while a higher standard deviation suggests more variability in the data.
In practical terms, understanding the standard deviation can help you assess the consistency or reliability of your data set. A smaller standard deviation implies more precision and less variability, making it easier to make predictions or draw conclusions based on your data. On the other hand, a larger standard deviation could indicate greater uncertainty and potential outliers within your dataset.
By interpreting the results of your standard deviation calculation, you gain valuable insights into the distribution and dispersion of your data points. This information can guide decision-making processes, identify patterns or trends in your data, and ultimately enhance statistical analysis techniques for future projects. How to calculate standard.
Common Misconceptions about Standard Deviation
When it comes to standard deviation, there are a few common misconceptions that can lead to confusion. One of the biggest myths is that standard deviation always represents the average distance of data points from the mean. In reality, standard deviation measures the dispersion or spread of data around the mean.
Another misconception is that a higher standard deviation indicates bad data or errors in measurement. However, a larger standard deviation simply suggests greater variability within the dataset. It doesn’t inherently imply incorrectness.
Some may mistakenly believe that outliers significantly skew their results, making standard deviation unreliable. While outliers can impact calculations, proper statistical analysis considers these extreme values and their effects on measures like standard deviation.
Some might think that comparing two datasets solely based on their standard deviations provides a complete picture. Remember, context matters – consider other statistical measures alongside standard deviation for a comprehensive understanding of your data’s distribution and variability. Also, Click
Conclusion
Calculating standard deviation may seem daunting at first, but once you grasp the concept and follow the steps outlined in this article, it becomes a valuable tool for analyzing data variability. Standard deviation provides insight into how spread out the values in a dataset are from the mean, helping statisticians make informed decisions based on data distribution.
By understanding the importance of standard deviation in statistics and learning how to calculate it accurately, you can confidently interpret results and draw meaningful conclusions from your data analysis. Remember that standard deviation helps quantify variability and risk, making it an essential metric for researchers, analysts, and decision-makers across various industries.
So next time you encounter a dataset that requires statistical analysis, don’t shy away from calculating its standard deviation. Embrace this powerful measure of dispersion to uncover patterns, identify outliers, and gain deeper insights into your data. Happy calculating!